Theory
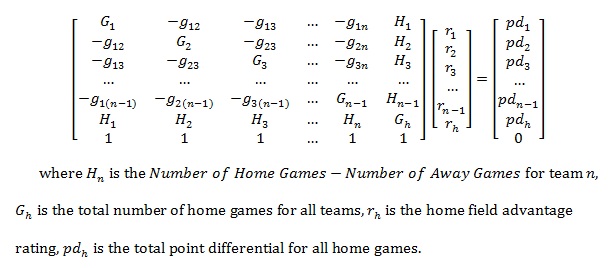
This rating system was created for my graduate project at North Dakota State University. It takes into account the location of games played and the final score. The mathematics behind the ratings are based on the least squares approach and the system of equations that is created is of the following form:
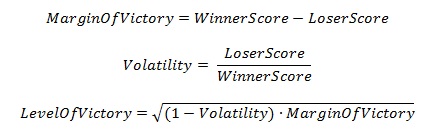
However, the Hensley Rating system does not use the point differential directly. Instead, it uses a function to compute a value from each game's final score. The equation is the following:
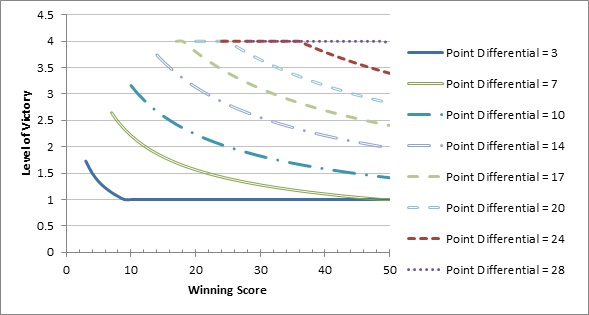
To get an idea of how this equation maps out to various scores, I plotted the values for various point differentials. The graph below shows how greater point differentials result in a higher level of victory, but with a diminishing return as the winning score increases. The rationale behind this is that games with higher scores have a higher level of unpredictability. For instance, a team that loses 10 - 0 is much less likely to have won the game given a few breaks or another drive than a team that loses 40 - 30.
The intent of the Hensley Rating is to reward teams that play a difficult schedule and win games with a
high level of victory. Therefore, defensively dominant teams that keep the scores low but have lower point
differential than some of the high scoring offenses won�t be penalized. I believe this greatly bridges the
importance of both defense and offense in a team. In rating systems with only point differential, a team with
a mediocre defense but a terrific offense is rewarded much more than a team with a terrific defense but a
mediocre offense.
To learn more about the Hensley Rating, feel free to read through my graduate paper here.
Listed below are the current BCS computer ratings: